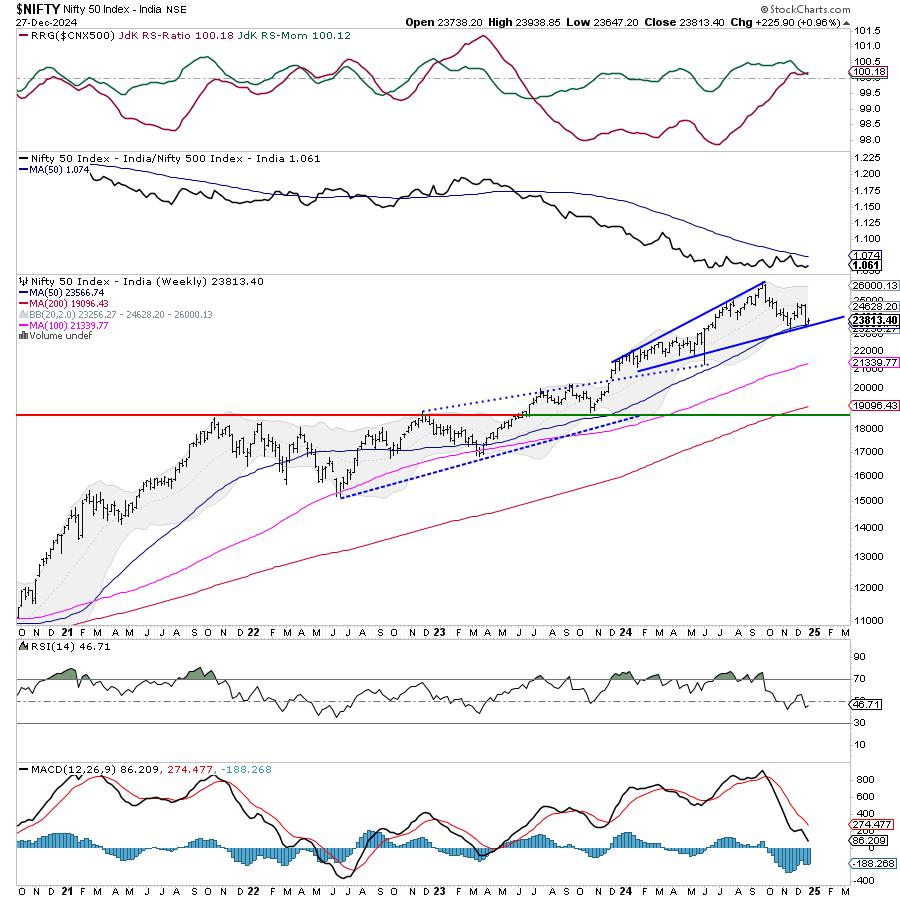
After suffering a brutal selloff in the week before this one, the Nifty spent the truncated week struggling to stay afloat just below the key resistance levels. With just four working days, the Nifty resisted each day to the 200-DMA and failed to close above that point. The trading range got much narrower, and the Nifty oscillated in just 291.65 points before closing with a minor gain. The volatility also cooled off as compared to the previous seek. Against the surge of 15.48%, this week saw India VIX declining by 12.17% to 13.24. Following strong consolidation, the headline index closed with a modest weekly gain of 225.90 points (+0.96%).

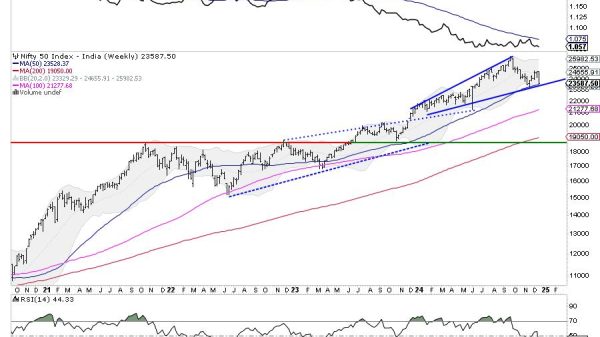
From a technical perspective, we are now at a very crucial juncture. On the one hand, the Nifty has closed below the 200-DMA placed at 23861. On the other hand, the Index is just above the 50-week MA at 23568. Rounding off, this puts Nifty in a very fragile range of 23860-23500. The Nifty will have to stay above the 23500 level; any violation of this level will instill prolonged weakness in the markets and push them into intermediate corrective trends. It also needs to be noted that the technical rebound would be sustained only if Nifty is able to cross and close above its 200-DMA. The longer the Nifty stays below 200-DMA, the more vulnerable it will be to testing the 50-week MA again.
Given the holiday season, no major moves are expected globally. The Indian markets are likely to start on a quiet note. The levels of 24000 and 24150 are likely to act as resistance points. The supports come in at 23600 and 23450.
The weekly RSI is 43.74; it stays neutral and does not show any divergence against the price. The weekly MACD is bearish and stays below the signal line. A Spinning Top occurred on the candles, depicting the market participants’ indecisive mindset.
The pattern analysis shows that the Nifty has retested the 50-week MA placed at 23568 again. While the Nifty has closed above this level following a modest rebound, it remains below the crucial 200-DMA. This means that so long as the Nifty is within the 23860-23500 zone, it is unlikely to adopt any sustainable directional bias. A trending move would occur only if the Nifty takes out 23860 on the upside or ends up violating 23500 levels.
Overall, it is important to observe that the markets are not totally out of the woods yet. So long as they are trading below the 200-DMA, they remain vulnerable to a retest of the 50-week MA. A violation of this level would mean a prolonged period of incremental weakness for the markets. It is recommended that all fresh buying must be kept defensive while keeping leveraged exposures at modest levels. For a rebound to sustain, it is immensely important for the markets to cross and close above 200-DMA. Until this happens, we need to approach the markets on a cautious and highly selective basis.
Sector Analysis for the coming week
In our look at Relative Rotation Graphs®, we compared various sectors against CNX500 (NIFTY 500 Index), which represents over 95% of the free float market cap of all the stocks listed.

Relative Rotation Graphs (RRG) continue to show Nifty IT, Banknifty, Services Sector, and Financial Services indices inside the leading quadrant. Although these groups are showing some slowdown in their relative momentum, they will likely continue outperforming the broader markets relatively.
The Midcap 100 index shows sharp improvement in its relative momentum while staying inside the weakening quadrant. The Nifty Pharma index is also inside this quadrant.
The Nifty PSE, Media, Infrastructure, Energy, Auto, Commodities, FMCG, and Consumption sectors are inside the lagging quadrant. They are likely to underperform the broader markets relatively.
The Nifty Metal index is inside the improving quadrant; however, it is rapidly seen giving up on its relative momentum. Besides this, the Realty and the PSU Bank indices are also inside the improving quadrant. They are expected to continue improving their relative performance against the broader markets.
Important Note: RRG™ charts show the relative strength and momentum of a group of stocks. In the above Chart, they show relative performance against NIFTY500 Index (Broader Markets) and should not be used directly as buy or sell signals.
Milan Vaishnav, CMT, MSTA
Consulting Technical Analyst

