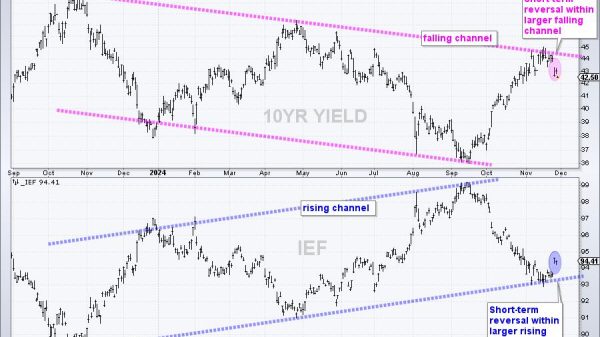
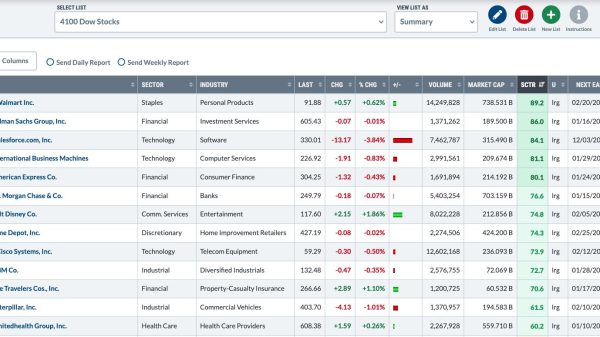
 In this exclusive StockCharts video, Joe shows how to use the MACD zero line as a bias for a stock. As opposed to offering a buy signal, this Zero line level can provide insight into a market or stock’s underlying condition; Joe shows how to refine that information with other indicators. He then covers the shifts that are taking place in the sectors, and finally goes through the symbol requests that came through this week, including DIS, TSLA, and more.
This video was originally published on December 11, 2024. Click this link to watch on StockCharts TV.
Archived videos from Joe are available at this link. Send symbol requests to stocktalk@stockcharts.com; you can also submit a request in the comments section below the video on YouTube. Symbol Requests can be sent in throughout the week prior to the next show.


