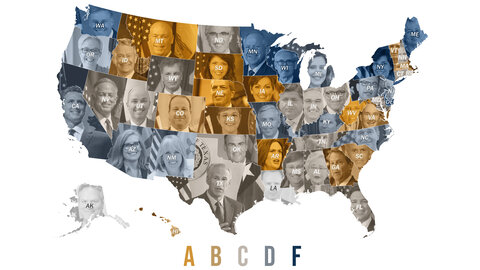
Cato has released the 17th biennial Fiscal Report Card on America’s Governors. The report grades the governors on their tax and spending records since 2022. Governors who have restrained taxes and spending receive higher grades, while those who have increased taxes and spending receive lower grades.
Six governors receive a grade of A: Kim Reynolds of Iowa, Jim Pillen of Nebraska, Jim Justice of West Virginia, Sarah Huckabee Sanders of Arkansas, Kristi Noem of South Dakota, and Greg Gianforte of Montana.
These governors have led the largest wave of state tax-cutting in decades. As discussed in the report, half of the states have cut individual or corporate income tax rates in recent years.
Kim Reynolds of Iowa is the highest-scoring governor. She signed into law a series of major tax reforms and held annual average spending growth to just 2.3 percent.
Tim Walz of Minnesota is the lowest-scoring governor. His biennial budget in 2023 hiked spending 36 percent, and he has raised business taxes, payroll taxes, vehicle taxes, and individual income taxes. His F grade is well-deserved.
The report discusses the fiscal record of each governor and looks at trends in taxation, spending, school choice, business subsidies, and debt.
The fiscal report card is here.


